

The Mission
The mission of the Unit is to aid researchers in their bioinformatics analysis and data processing. The Unit is currently equipped with state-of-the-art pipelines to provide researchers with a fully automated analysis and comprehensive publication-ready reports. Current pipelines can process data from:
-
Exome and Whole genome sequencing
-
Bulk RNA-sequencing (RNAseq)
-
Single cell RNA-sequencing (scRNAseq)
Researchers are encouraged to contact us and provide us with their expression matrix or fastq files, generated by the sequencer along with protocol details and experimental design. While our pipelines are offered as standard services and serve certain technologies, more advanced bioinformatics solutions can be performed upon request and in collaboration with our experts outside pMedGR’s main activities. Such analyses may include: epigenetic profiling, machine learning, functional annotation, enrichment of biological pathways and functions, trajectory (pseudotime), visualization, clustering and statistics.
Infrastructure
The facility is currently equipped with a DELL PowerEdge R740 server with 512 GB RAM memory, ~100TB storage capacity, and 44 Cores / 88 Threads. Proposed analyses may not exceed pMedGR’s data processing capacity, something that must be first communicated prior to execution. Analyses will be done on a first-come-first-serve basis.
Services

Exome and Whole Genome Sequencing
Genome and Exome sequencing can be used for the detection of both single nucleotide variations (SNPs) and copy number variations (CNVs). Notably, the exome makes up only 1.5% of the whole human genome and refers to the part of the genome which encodes genes.
Our pipeline follows the steps below:
-
Quality control of the raw sequences produced by the sequencer
-
Read mapping on a reference genome or transcriptome
-
Quality control for the mapped reads
-
Variant identification
-
Variant filtering
-
Variant characterization
Researchers will be provided with:
-
A report with results from the raw data quality control, alignment statistics, and read quality.
-
A file with the aligned reads.
-
A comprehensive report of the DNA alteration, accompanied by their exact locations, statistical significance and several confidence metrics.
-
Genome browser visualization.

Bulk RNA-sequencing
RNA sequencing (RNA-Seq) is a sensitive and accurate way for measuring gene expression across the transcriptome and provides researchers a useful tool for identifying undetected changes occurring in disease states, response to therapeutics, different environmental conditions as well as across a broad range of study designs.
Our pipeline follows the steps below:
-
Quality control of the raw sequences produced by the sequencer
-
Alignment to a reference genome or transcriptome
-
Alignment quality control
-
Transcripts’ expression quantification
-
Dimensionality reduction and visualisation
-
Differential expression analysis to identify the up- and down-regulated genes between two conditions
Researchers will be provided with:
-
A report with results from the raw data quality control including alignment statistics, and read quality.
-
A file containing the transcripts’ quantification.
-
A comprehensive report with the gene lists and their annotations accompanied by a statistical significance score and other confidence metrics.
-
The up- and down-regulated genes visualized in a volcano plot.
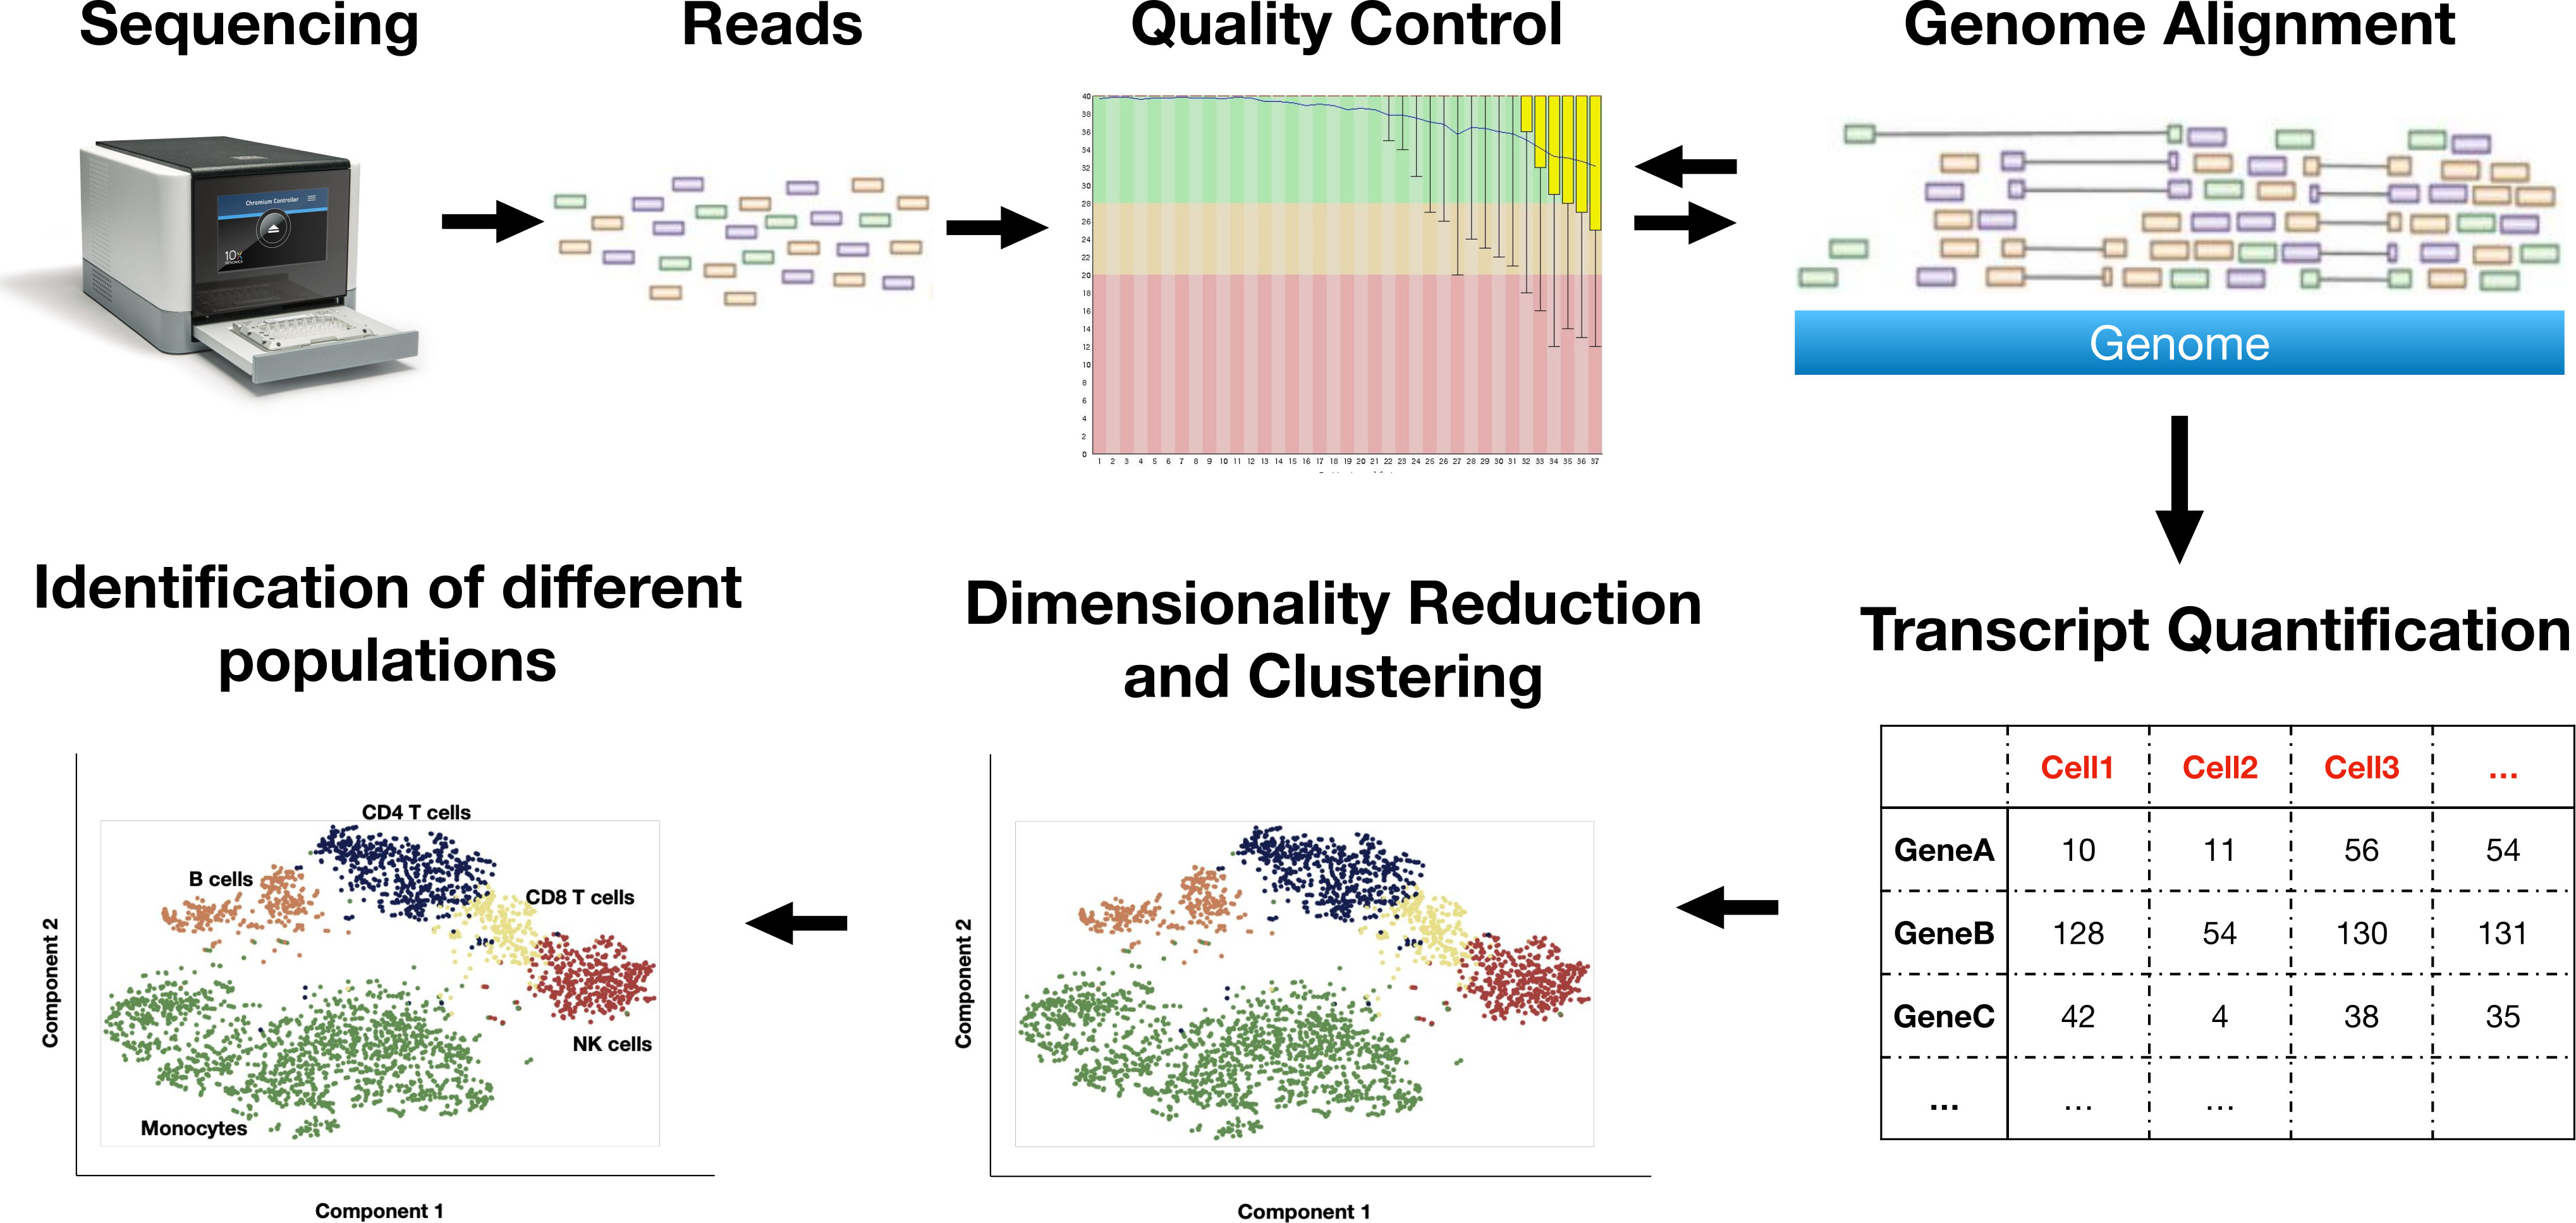
Single cell RNA-sequencing
Single-cell RNA sequencing (scRNAseq) is a technique to unravel the heterogeneity of the cells in a tissue based on their expression profiles. Different cell populations can be identified and compared between each other in order to uncover each population’s role in a tissue.
Our pipeline follow the steps below:
-
Quality control of the raw sequences produced by the sequencer
-
Alignment to a reference genome or transcriptome
-
Alignment quality control
-
Transcripts’ expression quantification
-
Dimensionality reduction and visualisation
-
Identification of different cell populations in a tissue after clustering based on the populations’ expression profiles
Researchers will be provided with:
-
A report with results from the raw data quality control including alignment statistics, and read quality scores.
-
A file with the transcripts’ quantification.
-
Basic visualization of the results (dimensionality reduction plots, cells clustering).